Measuring Content Production Velocity After AI Adoption
Teams chasing higher output must rethink which metrics actually matter now that AI handles volume.

Ninety-four percent of marketers plan to use AI for content creation in 2026, and 88% already use it every day. This piece is about what happens to the numbers teams use to judge their own output once that shift becomes the baseline, not the experiment. Only 19% of content marketing teams track AI-specific KPIs at all, according to Averi's 2026 benchmarks report. That gap, nearly everyone using the tools and almost nobody measuring what the tools are actually doing, is the whole story here, and most of what teams currently measure is answering a question that AI has already settled.
What content velocity actually measures, and how AI distorts each component
Volume and velocity get used as if they mean the same thing. They don't. Volume is a count: how many posts, how many assets, how many pieces landed in the calendar this month. Velocity, as Aprimo frames it, is the speed and efficiency of the whole lifecycle, from ideation through brief, draft, revision, approval, publish, and the performance read that follows. A team that ships fewer pieces but moves through that cycle without friction has higher velocity than a team cranking out volume while drowning in revision loops. Confusing the two is how a dashboard ends up celebrating the wrong thing, and it happens constantly.
AI compresses some parts of that cycle hard. Median time to a first draft on a 1,500-word post dropped from 4.6 hours to 1.1 hours, per a Q2 2024 study from The Starr Conspiracy covering 312 B2B tech organizations. Median fully loaded cost per published asset fell from $2,310 to $847 in the same study. Revision cycles shrink too, but not to zero: first-generation AI drafts carry a 22% brand voice deviation rate, so the editing burden doesn't disappear. It just moves downstream, from writing raw copy to correcting tone and fact.
What AI doesn't touch is the scaffolding around the content. Approval chains don't get shorter because a draft got faster. Strategic alignment between what gets written and what the pipeline actually needs doesn't improve because a model can generate ten more variations an hour, and brief quality going in still determines a huge share of what comes out. AI speeds up specific handoffs and leaves others exactly as slow as they were, which means a metric that only watches the draft stage looks like a miracle while the full cycle, brief to publish, might only be modestly faster. That mismatch is where most measurement goes wrong.
The traditional metrics that become misleading when AI raises the volume ceiling
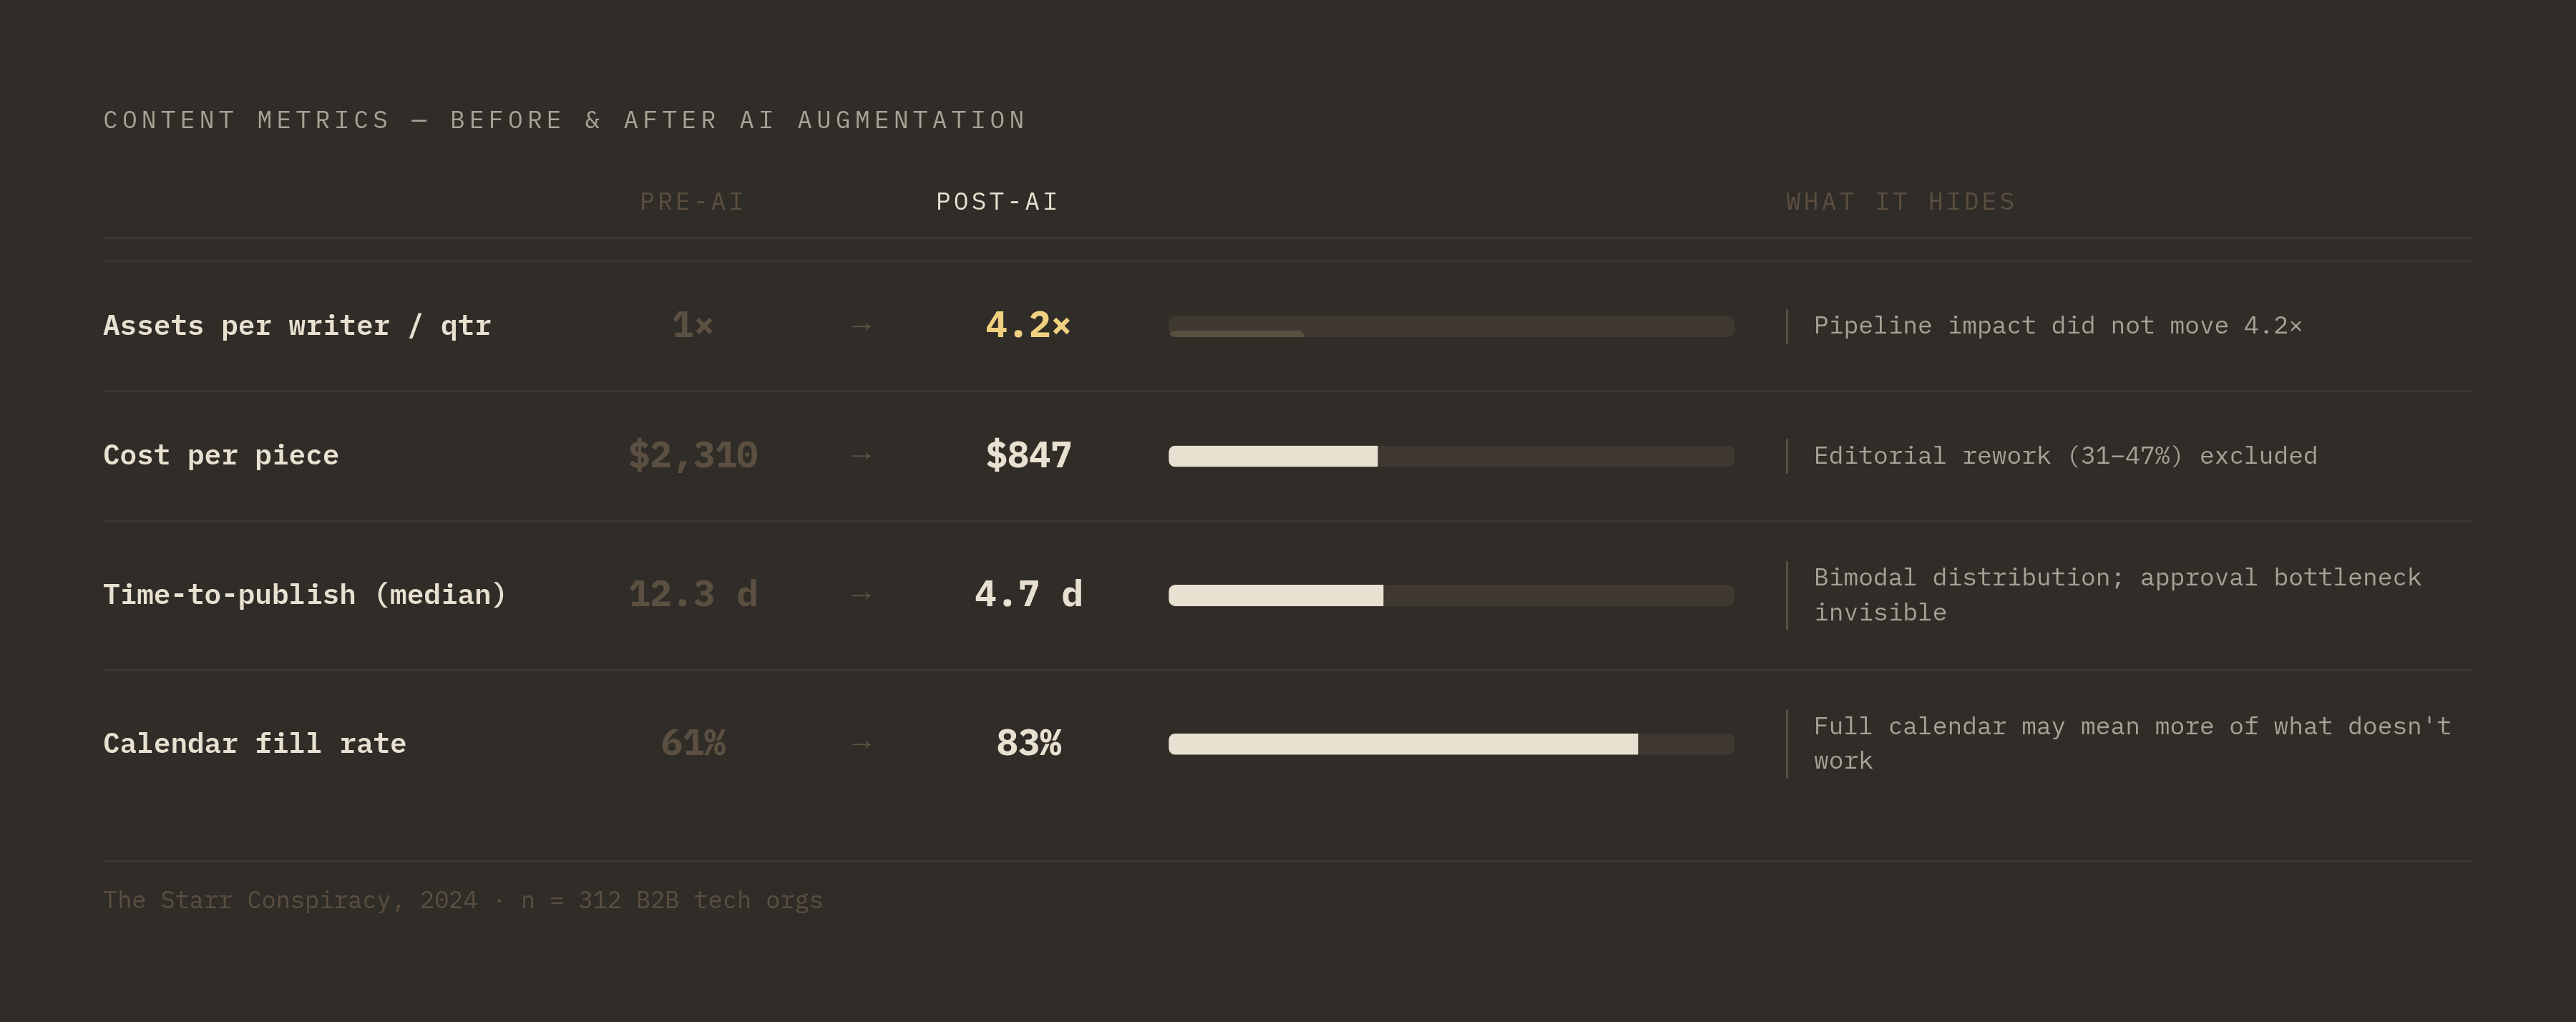
Assets per writer per month used to say something about team capacity. Now it mostly says how well someone configured the tool. The Starr Conspiracy's data shows AI-augmented B2B teams producing 4.2 times more published assets per writer per quarter in 2024 than their 2022 baseline. Real number. But if output quadruples and pipeline impact doesn't move anywhere close to that ratio, the metric is flattering the team instead of informing it, and a team that trusts it is measuring its own busyness.
Cost per piece has the same problem in a different shape. AI tools cut unit-level production cost by 60 to 70%, which sounds decisive until you weigh it against what McKinsey found in March 2024: human edit rates on AI-generated copy run between 31 and 47% of the word count. That editorial time didn't vanish. It moved, and a team quoting raw cost-per-piece without folding in that editorial overhead is undercounting what the content actually costs to ship.
Time-to-publish, reported as a single average, now hides more than it reveals. The Starr Conspiracy puts the median end-to-end time at 4.7 days for AI-augmented teams versus 12.3 days pre-AI, a genuine gain. But a median flattens a distribution that's now bimodal: the writing stage compresses dramatically while approval and compliance steps sit exactly where they always sat. Report the average alone and the real bottleneck, wherever it's hiding, stays invisible. This is the metric most worth throwing out in its current form, because a single number here actively hides the one thing worth knowing.
Calendar fill rate tells a similar story. AI-augmented teams hit an 83% on-time fill rate against 61% pre-AI, per the same research. Good news on paper. But filling every slot on the calendar isn't the same as filling it with the right content, and a full calendar can just as easily mean a team is producing more of what doesn't work, faster.
All four of these metrics share one flaw: they were built to answer whether a team could produce enough content. AI has settled that question already. What these older metrics can't answer is whether the content being produced is any good, and that's the question every team should actually be asking now.
The velocity metrics that still hold, and what they need to account for now
Revision cycles per asset are still worth tracking, but what they measure has changed. Before AI, revision counts mostly reflected a writer's skill or how clear the original brief was. Now they mostly reflect how well someone configured the prompt, the context window, and the brand guidelines feeding the model. Teams should split this number by workflow, AI-first drafts against human-first drafts, to see which approach actually cuts down on editing, instead of assuming AI drafts automatically need less work. That assumption is usually wrong.
End-to-end time from brief to publish is still probably the most honest single number available, precisely because it captures the whole cycle instead of one sped-up handoff. But it needs breaking into stages: brief to draft, draft to approval, approval to publish. AI reshapes the first stage almost completely. The second and third stages are where the organizational drag AI can't touch becomes visible, and that's exactly the information a single blended average destroys.
Calendar coverage rate still has value, just a narrower one. An 83% fill rate shows the scheduling problem is basically solved, which frees teams to stop asking whether they can fill the calendar and start asking whether they're filling it with topics that matter.
Asset reuse and repurposing ratio matters more now than it used to. Research from CMI (September 2024) found AI-augmented teams generating a large number of derivative assets per pillar piece, and tracking that ratio separates strategic use of AI from teams just cranking out standalone posts that go nowhere. A high repurposing ratio points to a content strategy that compounds. A low one, even next to impressive output numbers, points to volume without leverage.
Every metric that survives needs a baseline reset to account for AI adoption. Measuring today's numbers against a pre-AI baseline doesn't measure progress, it measures the size of the jump AI caused, which is a different thing.
The new indicators teams need to add when AI removes the production constraint
Brand voice fidelity rate deserves its own line item. First-generation AI drafts deviate from brand voice at a 22% average rate, roughly one in five sentences flagged off-tone, per The Starr Conspiracy. That number needs tracking per workflow and per tool setup, not just checked at the point of publication when it's too late to fix cheaply. The industry isn't set up to catch it: as of Gartner's May 2024 CMO Spend and Strategy Survey, only 28% of B2B organizations had a documented AI governance policy. Most teams are scaling output with no fidelity baseline to check it against, which is a governance failure dressed up as a productivity win.
Human editorial intervention rate is the metric that tells you whether your AI setup is getting better or worse over time. McKinsey puts the range at 31 to 47% of AI-generated word count requiring substantive rewriting before it can ship. Track your own number and watch the trend line. A rising intervention rate next to rising output volume is a warning, no matter how the calendar looks, that the tooling or the prompting needs work.
Content format diversification matters because the 4.2x output jump from The Starr Conspiracy's data doesn't say whether that growth spread across formats or piled up in one place. Video scripts, sales enablement docs, webinar abstracts, email nurture sequences: all of these now sit inside the reach of AI-assisted production, and a velocity dashboard that only tracks blog posts is measuring a shrinking slice of the actual work.
Pipeline attribution per published asset is the metric that ties all of this back to revenue. The Starr Conspiracy found a median 18% lift in marketing-sourced pipeline within nine months of operationalizing AI content. But Forrester's 2024 research found only around 39% of B2B marketing teams report moderate or high confidence in their revenue attribution, with 61% reporting low confidence. Tracking output volume without pipeline attribution means optimizing a production line that's disconnected from the business result it's supposed to serve.
And then there's a layer most teams haven't built a place for yet: how visible that content is to the AI systems now doing a growing share of the discovery work.
Why AI search visibility belongs in a content velocity dashboard, not a separate analytics track
Treating AI search visibility as a separate report from content velocity is the single biggest measurement mistake teams are making right now. It's part of the same discipline. It's the other half of the same question, and splitting them into two dashboards is why so many teams can't see the problem coming.
Averi's 2026 benchmarks report puts AI Overviews on 48% of all search queries as of February 2026, reaching something like 2 billion monthly users, and Previsible's AI Traffic Report shows AI-sourced traffic surging sharply between November 2024 and May 2026. Content built at AI speed is now getting judged by AI systems on the other end. A team's production rate and its citation rate inside AI answers belong in the same conversation, not two separate ones, because they're describing the same pipeline from opposite ends.
The clearest diagnostic here is the growing gap between where a page ranks in Google and whether an AI answer cites it at all. Available research suggests the overlap between top-ranking Google links and the sources AI systems actually cite has dropped sharply. Ranking well no longer guarantees a mention in the answer a buyer actually reads, and producing more content at higher velocity without tracking citation share means having no idea whether that faster output reaches buyers where a growing share of discovery now happens.
Citation share is also volatile in a way that makes a quarterly check next to useless. Available research suggests brand visibility from one AI-generated answer to the next is highly inconsistent. Content under three months old gets cited at three times the rate of older content, per the same research, cited in Averi's report. Freshness cadence is a substantive factor here. It's a velocity decision with a direct line to whether AI systems keep citing a brand at all.
Writer.com's guide on GEO and AEO measurement puts the split at roughly 80% strategic work (positioning, ecosystem presence, brand authority) and 20% technical fixes. That ratio matters because it means the choices a content team already makes, which topics to cover, which formats to use, how often to refresh a page, are the same choices driving AI citation outcomes. It's downstream of the exact same decisions a content strategist makes every week, not a specialist skill bolted on afterward.
For agencies handling several brands at once, tracking AI citation rate per client turns this into a reporting layer that ties production activity directly to AI discovery performance, visible at the portfolio level and not buried inside one account's numbers.
How agencies managing multiple brands need to structure velocity measurement differently from in-house teams
Agencies feel this measurement problem more sharply than in-house teams do, because the numbers carry commercial weight, not just operational ones. Industry data from Digital Applied shows AI compressing deliverable timelines by 3 to 4 times at some creative shops. The same output now takes a fraction of the billable hours it used to, which changes what "velocity" means as a business term, not only as a workflow one.
That creates two separate reporting jobs, and conflating them is a mistake most agencies still make. Internally, ops teams need to know whether production is actually efficient. Externally, client-facing teams need to prove that content activity produces results the client can see and believe. Different questions, answered with different numbers. Collapsing them into one dashboard usually satisfies neither audience.
Aggregation is the other structural headache. A single account team might run velocity metrics across a dozen brands, and a blended, portfolio-wide number hides exactly which accounts are working and which need intervention. Per-client breakdowns are a necessity here. They're what lets an account team catch a problem before the client does.
There's a sales conversation buried in this too. GEO adoption is moving faster on the agency and specialist side than among client-side marketing teams, but most client-side marketing teams haven't caught up yet. That gap is an opening, but only for agencies whose account teams can explain, in plain terms, what an AI citation rate is and why a client should care. An agency that walks a client through their mention frequency and sentiment across tools like Perplexity and ChatGPT is telling a story a conventional velocity report never could.
And driving all of it is a billing question nobody wants to say out loud: if AI cuts the time behind each deliverable by three or four times, a strictly hourly billing model quietly erodes the agency's own perceived value. Output-based or outcome-based reporting is a matter of accuracy, not just a nicer story to tell. It's the only framework that keeps the commercial math honest once the production constraint that used to justify hourly billing has mostly disappeared.
Building the measurement stack: the sequence teams should follow to get an accurate read after AI changes the baseline
Start by setting a new baseline, before comparing anything to last year. Document current organic traffic, keyword rankings, conversion rates, AI mention frequency, cost per piece, and revision cycles as they stand right now. A pre-AI number isn't a fair comparison anymore; it describes a production environment that no longer exists. Measuring today's output against a 2022 or even early-2024 benchmark doesn't show progress. It shows how big the jump was, which is a different and far less useful thing to know.
From there, the sequence matters less than the discipline of splitting metrics into two piles: the ones that need new context (revision cycles, end-to-end time, calendar coverage) and the ones that need adding outright (brand voice fidelity, editorial intervention rate, format diversification, pipeline attribution, AI citation share). Skip the first pile and old metrics keep comparing today's world to a baseline that no longer applies. Skip the second and the dashboard keeps answering a question nobody's asking anymore, whether the team can produce enough, while missing the one that actually counts now: whether what's being produced, at this new speed, reaches the people it's meant for and does something once it gets there.